Qligent has introduced a series of new visualisation tools for its flagship Vision cloud monitoring platform that strengthen regulatory compliance, bandwidth optimisation and workflow management for broadcasters and MVPDs. Qligent is demonstrating the expanded toolset at the 2016 NAB Show at Booth N1011. First introduced in 2014, Visions flexible approach to multiplatform TV monitoring has […]
 Qligent has introduced a series of new visualisation tools for its flagship Vision cloud monitoring platform that strengthen regulatory compliance, bandwidth optimisation and workflow management for broadcasters and MVPDs. Qligent is demonstrating the expanded toolset at the 2016 NAB Show at Booth N1011.
First introduced in 2014, Visions flexible approach to multiplatform TV monitoring has caught on with broadcasters and MVPDs globally. In the past 12 months, Qligent has deployed several thousand of its networked monitoring probes across six continents. This level of scale has driven requirements for a much stronger and intuitive level of visualisation, allowing monitoring staff to make sense of the rich and diverse amount of data collected.
Ted Korte, COO of Qligent, notes that the new visualisation enhancements to be unveiled at NAB further strengthen Qligents mile wide, inch deep approach to wide-scale QoS and QoE monitoring of TV services.
Our new visualisation features for Vision are, to a strong degree, based on customer requests and industry trends we see taking shape as more broadcasters transition to cloud services, said Korte. Considering the scale of which we can deploy Vision systems in on-premise, cloud and managed service configurations, we intend to continue down the path of IoT-based probe deployment to shrink the cost of data collection, and grow our contribution to big data and analytics ecosystems.
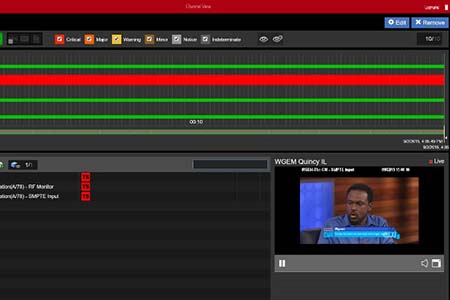
Visions fully customisable dashboard is essential to monitoring success whether deploying Vision as a SaaS or via Qligents Oversight 24/7 managed service, the industrys first monitoring-as-a-service (MaaS) platform. These new visualisation features at NAB include:
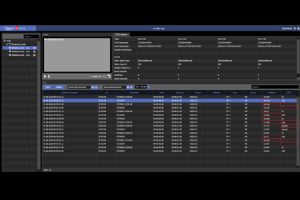
- Off-Air Counter: A regulatory tool that monitors and records how long a station has been off-air or out of compliance due to signal loss or other performance issues. The off-air counter is burnt into the recorded video, and Visions dashboard ensures users can easily visualise and export information to government regulators, show evidence of how long the issue persisted and when and how it was resolved. Each record can include a variety of information, including program name, timecode, audio bars and captions.
- Bitrate Monitoring: Considering the dynamic nature of payload, Qligent has innovated flexible pie charts on the Vision dashboard to help broadcasters intelligently track bitrate fluctuations for multiple programs; and monitor usage across IP, RF, fibre and other transport layers. Users can click on any customisable graphic for visibility into how much bandwidth each program stream or channel occupies, with detailed insight into video, audio and data bitrates; and how error correction affects overall bandwidth optimisation.
- Multi-dimensional Dashboards: This comprehensive dashboard is ideal for systems with thousands of monitoring points, simplifying visibility across larger dispersed, multi-channel networks. Customisable by department and user, Visions dashboards offer a variety of perspective views for visualisation into locally, nationally and globally deployed probes; as well as video/audio formats, QoS/QoE layers, delivery platforms and more.
- Impact Analysis: This quick 1-2-3 step process determines the overall impact a problem has on the broadcasters viewership, as well as the impact to internal departments. Visions Impact Analysis allows for an actionable, reasonable and proportionate response when problems occur, significantly increasing productivity through quick determination of rapid response required to triage to nuisance faults requiring scheduled tuning.
t
t
t
t


